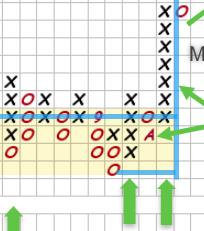
There are a number of effective swing trading systems being used today. Let’s explore one that is popular among Wyckoffians. It uses two inputs: Point and Figure charts and volume. Let’s review this system with a case study of Charles Schwab Corp. (SCHW). As markets are fractal, Accumulation and Distribution structures form in daily, weekly and monthly timeframes. Swing trading structures typically form on daily charts that can be identified with 1-box Point & Figure charts and daily vertical bar charts. Charles Schwab Corp. forms a Swing Trading Accumulation structure between July and October. In July climactic selling (SC) volume ends the decline, and an Automatic Rally (AR) sets the support and resistance of a range-bound condition to follow. Subsequent volume on rallies and reactions tells the tale of latent Accumulation. This chart is rich with Wyckoffian principles, and it has been marked up for your study and evaluation. Let’s…
There are a number of effective swing trading systems being used today. Let’s explore one that is popular among…
There are a number of effective swing trading systems being used today. Let’s explore one that is popular among…
It’s an interesting market day with the market moving lower despite positive seasonality. Natural Gas (UNG) broke out in…
There are a number of effective swing trading systems being used today. Let’s explore one that is popular among…
Generally, there are 3 key hedges against inflation – gold ($GOLD), commodities ($XRB), and real estate (XLRE). While the…
After suffering a brutal selloff in the week before this one, the Nifty spent the truncated week struggling to…
In this video, Mary Ellen highlights whether to buy last week’s pullback. She discusses the rise in interest rates…

