Author

admin

Browsing

Here are some charts that reflect our areas of focus this week at XLU Leads with New High Even though the Utilities SPDR (XLU) cannot keep pace with the Technology SPDR (XLK) and Communication Services SPDR (XLC), it is in a leading uptrend. XLU formed a cup-with-handle from November to July and broke to new highs the last two weeks. ETFs hitting new highs are in strong uptrends and should be on our radar. Metal Mania in 2025 In a tribute to Ozzy, metals are leading the way higher in 2025. The PerfChart below shows year-to-date performance for the continuous futures for 12 commodities. Copper, Platinum and Palladium are up more than 45% year-to-date, while Gold is up 28.38% and Silver is up 35.30%. QQQ is up 10.52% year-to-date, but lagging these metals. The other commodities are mixed. Multi-Year Highs for Silver and Copper The next chart shows 11 year…

The S&P 500 ($SPX) just logged its fifth straight trading box breakout, which means that, of the five trading ranges the index has experienced since the April lows, all have been resolved to the upside. How much longer can this last? That’s been the biggest question since the massive April 9 rally. Instead of assuming the market is due to roll over, it’s been more productive to track price action and watch for potential changes along the way. So far, drawdowns have been minimal, and breakouts keep occurring. Nothing in the price action hints at a lasting change — yet. While some are calling this rally “historic,” we have a recent precedent. Recall that from late 2023 through early 2024, the index had a strong start and gave way to a consistent, steady trend. From late October 2023 through March 2024, the S&P 500 logged seven consecutive trading box breakouts. That…

Is the market’s next surge already underway? Find out with Tom Bowley’s breakdown of where the money is flowing now and how you can get in front of it. In this video, Tom covers key moves in the major indexes, revealing strength in transports, small caps, and home construction. He identifies industry rotation signals, which are pointing to aluminum, recreational products, and furnishings. Tom then demonstrates how to use StockCharts’ tools to scan for momentum stocks in emerging leadership groups — see why SGI tops Tom’s list. He ends with a discussion of post-earnings reactions from major names like GOOGL, TSLA, IBM, and LVS.  And, of course, Tom wraps every idea with clear chart setups you can act on today.  This video premiered on July 24, 2025. Click this link to watch on Tom’s dedicated page. Missed a session? Archived videos from Tom are available at this link.

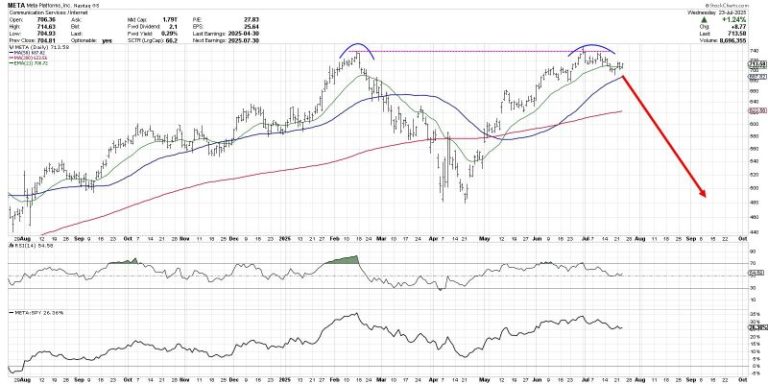
The chart of Meta Platforms, Inc. (META) has completed a roundtrip from the February high around $740 to the April low at $480 and all the way back again.  Over the last couple weeks, META has now pulled back from its retest of all-time highs, leaving investors to wonder what may come next. Is this the beginning of a new downtrend phase for META?  Or just a brief pullback before a new uptrend phase propels META to new all-time highs? Today we’ll look at two potential scenarios, including the double top pattern and the cup and handle pattern, and share which technical indicators and approaches could help us determine which path plays out into August. The double top scenario basically means that the late July retest of the previous all-time high was the end of the recent uptrend phase.  The double top pattern is literally when a major resistance level…

Markets don’t usually hit record highs, risk falling into bearish territory, and spring back to new highs within six months. But that’s what happened in 2025. In this special mid-year recap, Grayson Roze sits down with David Keller, CMT, to show how disciplined routines, price-based signals, and a calm process helped them ride the whipsaw instead of getting tossed by it. You’ll see what really happened under the surface, how investor psychology drove the swings, and the exact StockCharts tools they leaned on to stay objective.  If you’re focused on protecting capital, generating income, and sleeping well at night while still capturing the upside, this is a must-watch. Discover which charts deserve your attention now, what to ignore, and how to prep for the back half of 2025.  This video premiered on July 23, 2025. Click on the above image to watch on our dedicated Grayson Roze page on StockCharts TV.…

The stock market feels like it’s holding its breath ahead of Big Tech earnings. The first two days of the trading week were mostly quiet, but Tuesday gave us a few nuggets worth chewing on. The S&P 500 ($SPX) squeaked out another record close, up by a modest +0.06%. It’s barely a blip, but it keeps the uptrend intact. Tech momentum slowed down a tad, but we didn’t see a wave of selling. It was more like a little profit-taking after a strong run. No reason to hit the panic button just yet. StockCharts Tip: Head to the Market Summary page and take a glance at the Market Factors panel. On Tuesday, Large-Cap Growth and Large-Cap Momentum were the only factors in the red (see image below). FIGURE 1. MARKET FACTORS PANEL IN THE MARKET SUMMARY PAGE. Here you see the one-day performance metrics of the factors. You can change…

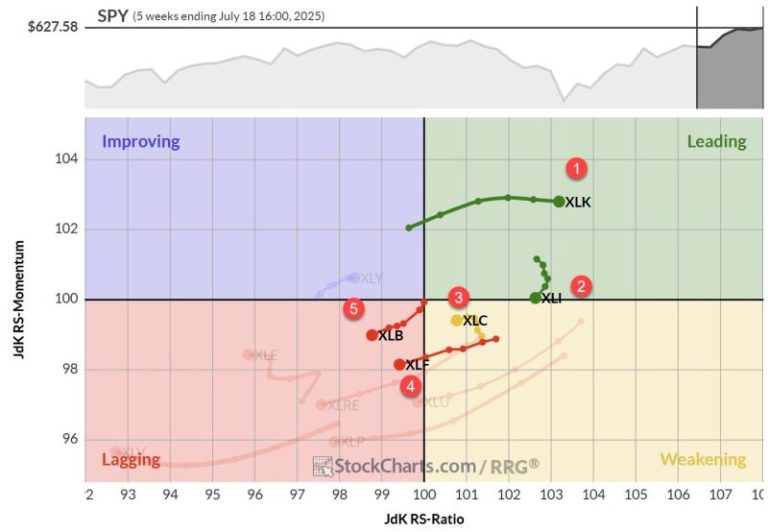
Sector Rotation Stalls, Tech Remains King Despite a slight rise in the S&P 500 over the past week, the sector rotation landscape is presenting an intriguing picture. For the first time in recent memory, we’re seeing absolutely no changes in the composition of the sector ranking — not just in the top five, but across the board. Will this stability kick off a return to a period of more significant trends in relative strength and a return to outperformance for the portfolio? (1) Technology – (XLK) (2) Industrials – (XLI) (3) Communication Services – (XLC) (4) Financials – (XLF) (5) Materials – (XLB) (6) Utilities – (XLU) (7) Consumer Discretionary – (XLY) (8) Consumer Staples – (XLP) (9) Real-Estate – (XLRE) (10) Energy – (XLE) (11) Healthcare – (XLV) Technology The tech sector continues to flex its muscles, moving up on the price ratio scale while maintaining a stable momentum…

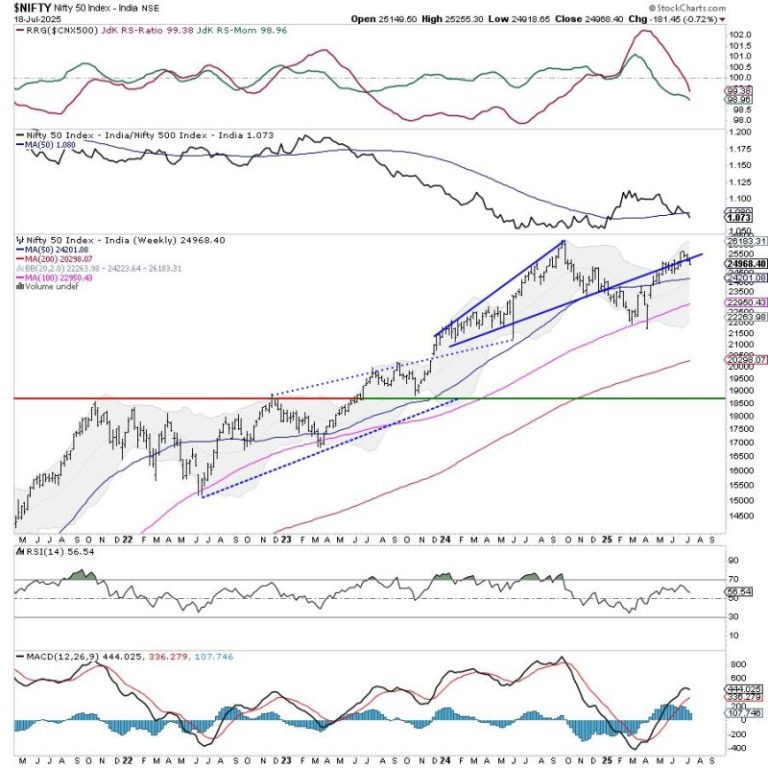
The Nifty traded in a broadly sideways and range-bound manner throughout the previous week and ended the week with a modest decline. The Index oscillated within a narrow 276-point range, between 25144.60 on the higher end and 24918.65 on the lower end, before settling mildly lower. The India VIX declined by 3.60% over the week to 11.39, suggesting continued complacency in the markets. On a weekly basis, Nifty ended with a net loss of 181.45 points or (-0.72%). The Nifty is presently consolidating just below a key resistance zone after attempting a breakout above a rising channel. This zone, between 25100 and 25350, has proven to be a supply area where profit-taking has emerged. While the broader trend remains intact and the Nifty is above key moving averages, it is still within a complex zone of consolidation. This pause in momentum comes after a sharp up move from the lows…

In this video, Mary Ellen spotlights the areas driving market momentum following Taiwan Semiconductor’s record-breaking earnings report. She analyzes continued strength in semiconductors, utilities, industrials, and AI-driven sectors, plus highlights new leadership in robotics and innovation-focused ETFs like ARK. From there, Mary Ellen breaks down weakness in health care and housing stocks, shows how to refine trade entries using hourly charts, and compares today’s rally to past market surges. Watch as she explores setups in silver and examines individual stocks like Nvidia, BlackRock, and State Street. This video originally premiered on July 18, 2025. You can watch it on our dedicated page for Mary Ellen’s videos. New videos from Mary Ellen premiere weekly on Fridays. You can view all previously recorded episodes at this link. If you’re looking for stocks to invest in, be sure to check out the MEM Edge Report! This report gives you detailed information on the top sectors, industries and…

Even with a few short-lived roller coaster rides, the stock market had a strong week. Though there was some selling on Friday, the S&P 500 ($SPX) and Nasdaq Composite ($COMPQ) closed up over the week as a whole, while the Dow Jones Industrial Average ($INDU) closed lower by 0.07%. Earnings season has started on a positive note, with big banks and Netflix, Inc. (NFLX) reporting better-than-expected earnings. Inflation remains relatively tame and the labor market remains resilient. This has helped fuel the stock market’s higher trajectory, with sectors such as Technology, Industrials, and Financials showing strong upward moves.  Even small-caps are hanging in there, although they have pulled back a bit. This price action supports broad participation in the market. The S&P 500 Equal-Weighted Index ($SPXEW) is also holding strong, trading above its 20-day exponential moving average. This tells us that participation isn’t limited to a handful of giants. A…