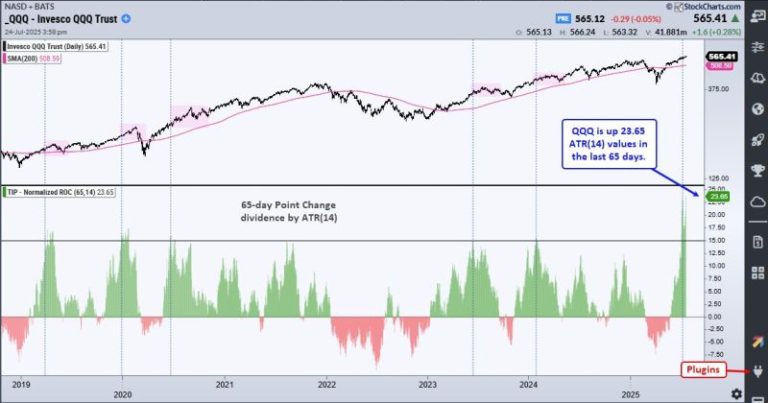
Here are some charts that reflect our areas of focus this week at XLU Leads with New High Even though the Utilities SPDR (XLU) cannot keep pace with the Technology SPDR (XLK) and Communication Services SPDR (XLC), it is in a leading uptrend. XLU formed a cup-with-handle from November to July and broke to new highs the last two weeks. ETFs hitting new highs are in strong uptrends and should be on our radar. Metal Mania in 2025 In a tribute to Ozzy, metals are leading the way higher in 2025. The PerfChart below shows year-to-date performance for the continuous futures for 12 commodities. Copper, Platinum and Palladium are up more than 45% year-to-date, while Gold is up 28.38% and Silver is up 35.30%. QQQ is up 10.52% year-to-date, but lagging these metals. The other commodities are mixed. Multi-Year Highs for Silver and Copper The next chart shows 11 year…
The S&P 500 ($SPX) just logged its fifth straight trading box breakout, which means that, of the five trading ranges…
Is the market’s next surge already underway? Find out with Tom Bowley’s breakdown of where the money is flowing now…
The chart of Meta Platforms, Inc. (META) has completed a roundtrip from the February high around $740 to the…
Markets don’t usually hit record highs, risk falling into bearish territory, and spring back to new highs within six…
The stock market feels like it’s holding its breath ahead of Big Tech earnings. The first two days of…
Sector Rotation Stalls, Tech Remains King Despite a slight rise in the S&P 500 over the past week, the…
The Nifty traded in a broadly sideways and range-bound manner throughout the previous week and ended the week with…
In this video, Mary Ellen spotlights the areas driving market momentum following Taiwan Semiconductor’s record-breaking earnings report. She analyzes…

